How do you compare two models when one is slightly smarter but costs ten times more? Raw benchmark scores ignore price entirely, and naive score-per-dollar ratios let cheap, weak models dominate the rankings. I wanted a single number that answers a simple question: for what this model costs, how much intelligence am I actually getting?
This post describes a new “fair value” metric that combines intelligence and pricing into one score, in a way that stays calibrated as the market moves. The metric was developed in conjunction with Kimi K3, and it is live in my free web tool ollamadash, where you can see it visualized as a radar chart and rank models by it. Here is a shareable view of a subset of top models ranked by value.
The inputs
The metric needs exactly two things per model:
- A score on a 0-100 scale. The primary intelligence metric is the Artificial Analysis Intelligence Index, but any benchmark works - in ollamadash the same formula is applied per benchmark axis (coding, math, agentic tasks, and so on).
- A price in USD per million tokens. We take
max(input_price, output_price)as the single representative price. Cached-token discounts and other pricing nuances are ignored - the point is a fair, simple comparison, not a billing simulation.
Models with missing or $0 prices are excluded from the computation entirely. A $0 price in the data always means “we don’t know the price”, not “this model is free”, and treating it as free would corrupt the fit for everyone else.
The formula
Step 1 - price-adjusted raw value:
raw = score - λ · log10(price / P_ref)
P_refis a reference price of $0.05/M, the point of zero penalty. A model priced at $0.05/M keeps its full score; one at $0.50/M loses λ points; one at $5.00/M loses 2λ.λ(lambda) is fitted from the dataset, not picked by hand. It is the slope of an ordinary least-squares regression of score on log10(price) across all models with a valid score and a positive price, rounded to two decimals and recomputed whenever the underlying data refreshes.
λ has a nice interpretation: it is the market’s going exchange rate - how many points of intelligence a 10x higher price buys you on average. In the 2026-07-17 snapshot, λ ≈ 10.14 for the intelligence index (other benchmarks range from about 7 to 18). Fitting λ from the data is what keeps the metric fair over time: if intelligence gets cheaper across the board, the slope flattens and the price penalty softens automatically. A hand-picked λ would silently drift out of date.
Step 2 - min-max scaling to 0-100:
value = 100 · (raw - min) / (max - min)
where min and max are taken over the same set of priced models, per benchmark. After scaling, 100 is the best value in the dataset and 0 is the worst. (The reference price P_ref has no effect on the scaled result - it shifts all raw values by the same constant, which min-max scaling absorbs - it just keeps the raw numbers interpretable.)
Because λ is fitted from the same data the metric is scored on, the scaled value is essentially a normalized “beats the market” residual: how far a model sits above (or below) the intelligence-for-price trend line of the whole field.
Why not just score / price?
A plain ratio measures cheapness, not value. Prices in the dataset span about four orders of magnitude while useful scores span a factor of about two, so the ratio is dominated by the denominator - cheap, mediocre models float to the top. Raising the score to a power does not fix this either: the exponent required to balance the ranges is so large it makes the metric absurdly sensitive to tiny score differences. The logarithmic price penalty compresses price onto the same scale as the score, so neither variable dominates by range alone.
Worked examples
Using the 2026-07-17 snapshot for the intelligence benchmark (λ = 10.14, min = -24.22, max = 32.72):
| model | intelligence | price | raw | scaled value |
|---|---|---|---|---|
| Grok 4.5 (high) | 53.8 | $6.00 | 53.8 - 10.14·log10(120) = 32.72 | 100.00 |
| DeepSeek V4 Flash (max effort) | 40.3 | $0.28 | 40.3 - 10.14·log10(5.6) = 32.71 | 99.99 |
| Kimi K3 | 57.1 | $15.00 | 57.1 - 10.14·log10(300) = 31.98 | 98.71 |
| Claude Fable 5 | 59.9 | $50.00 | 59.9 - 10.14·log10(1000) = 29.48 | 94.31 |
| GPT-4 | 7.0 | $60.00 | 7.0 - 10.14·log10(1200) = -24.22 | 0.00 |
Two things worth noticing. First, the top of the table is a photo finish between a premium model (Grok 4.5) and a budget model (DeepSeek V4 Flash) - the metric is genuinely neutral about how you get your value. Second, GPT-4 anchors the bottom: once state of the art, now both weak and expensive relative to the market, so it defines the zero point.
See it live in ollamadash
The metric powers the Compare view in ollamadash, my free dashboard for exploring and comparing LLMs across providers. In value mode, every axis of the radar chart shows the value-adjusted score for that benchmark instead of the raw score, and each model in the legend carries its overall value score:
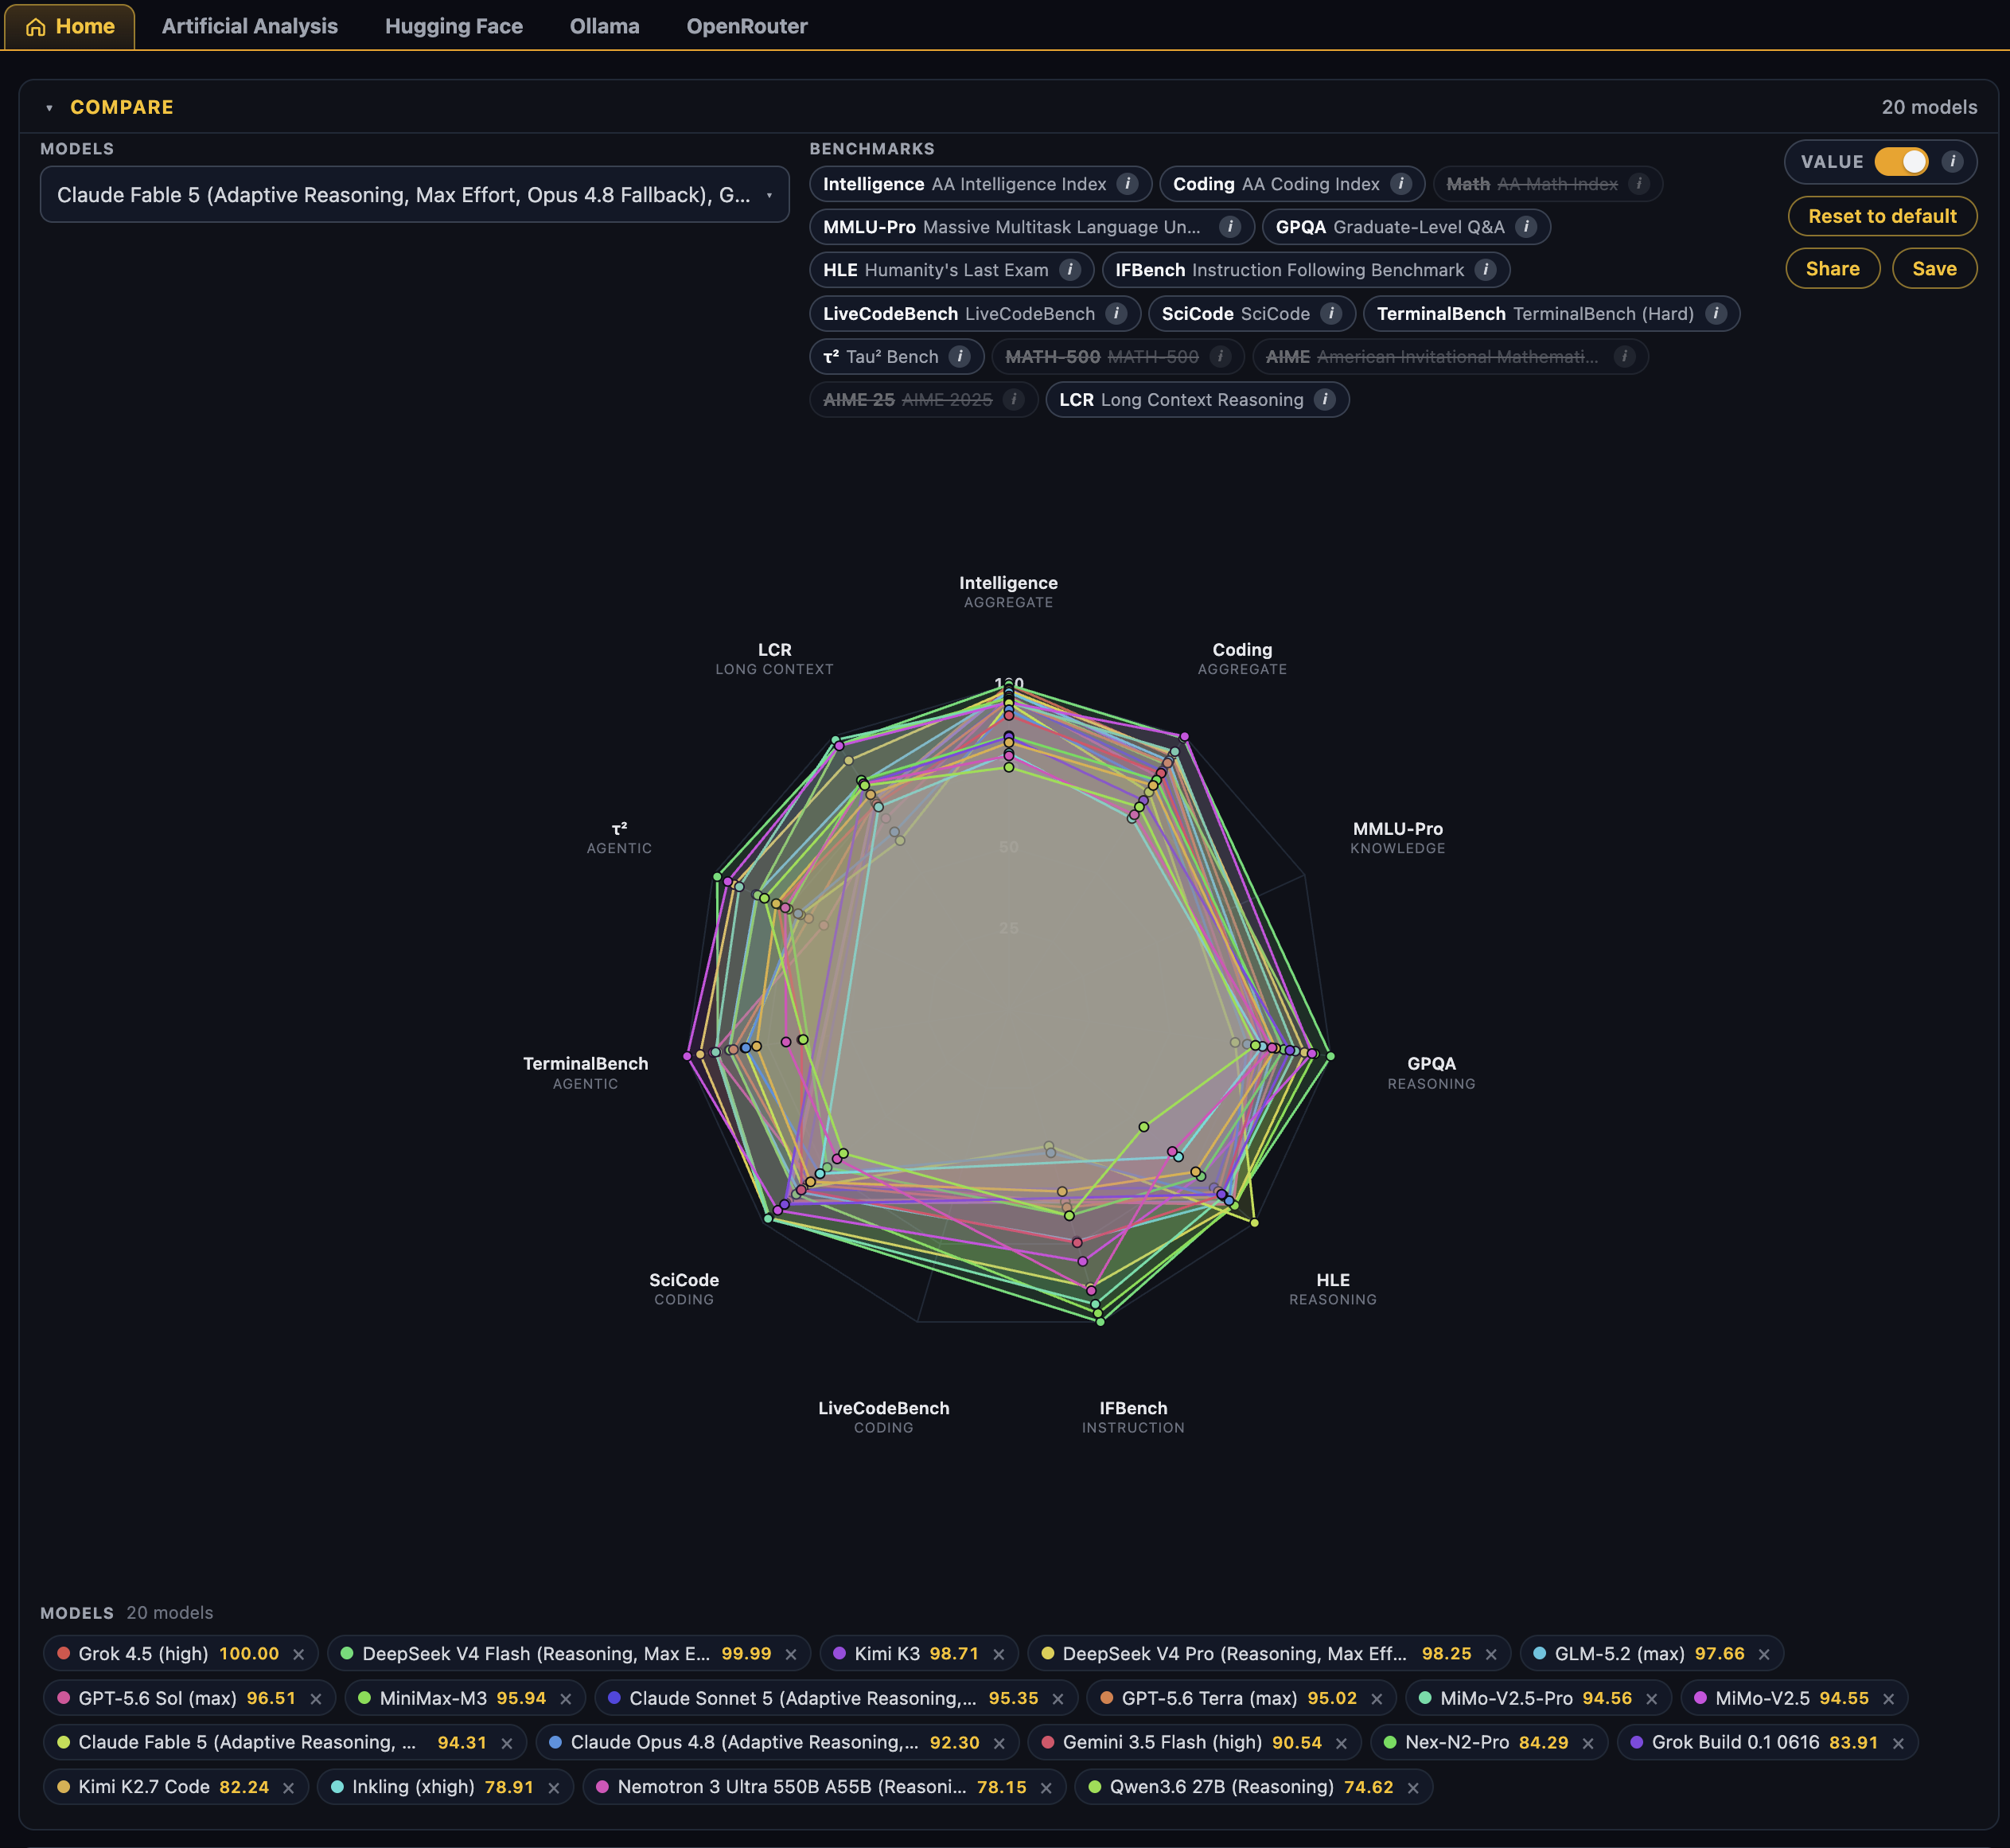
A detail that is easy to miss: the order of models in the legend below the compare area is the ranking by value. Grok 4.5 at 100.00 first, DeepSeek V4 Flash at 99.99 second, and so on down the list. Flip the VALUE toggle off (top right of the compare area) and the exact same set of models re-sorts to a ranking by raw intelligence - a quick way to see who is winning on capability versus who is winning on capability-per-dollar.
Hovering a legend entry shows the full breakdown: the scaled value score plus the raw computation, something like raw 31.98 = 57.1 - 10.14·log10($15.00 / $0.05), so the number is never a black box.
Try it yourself
The best way to get a feel for the metric is to poke at it:
- Open the compare view and toggle VALUE on and off to see the ranking flip between value and pure intelligence.
- Swap models in and out of the comparison - pick your daily drivers and see where they actually land on the value curve.
- Change the benchmark axes. λ is fitted per benchmark, so a model that is great value on coding can be mediocre value on math - the radar makes that visible immediately.
- Share your setup with the Save/Share buttons - the full comparison state is encoded in the URL, like the link in this post.
The implementation lives in the ollamadash source (app.js for the live version, mirrored in Python in the test suite), and the exact spec is in metric.md in that repo. If you have ideas for improving the metric - different anchors, robust regression for λ, per-task weightings - I would love to hear them.
Discussion